
LINEAR SCHEDULING 101




The Problem
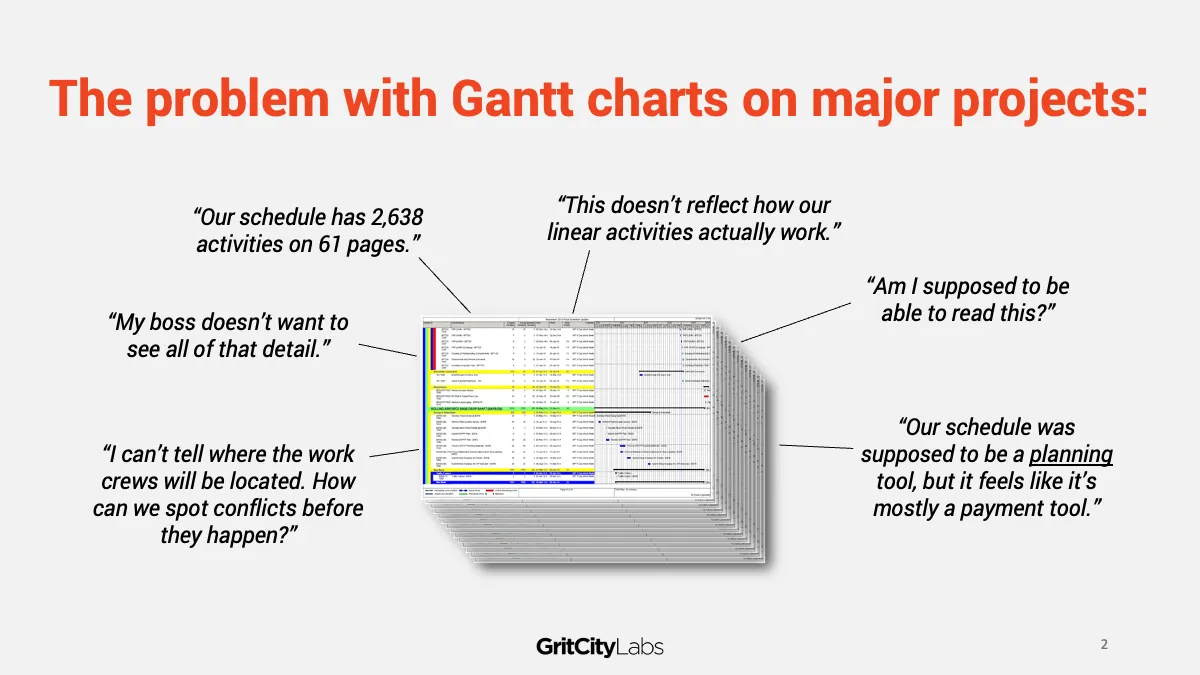
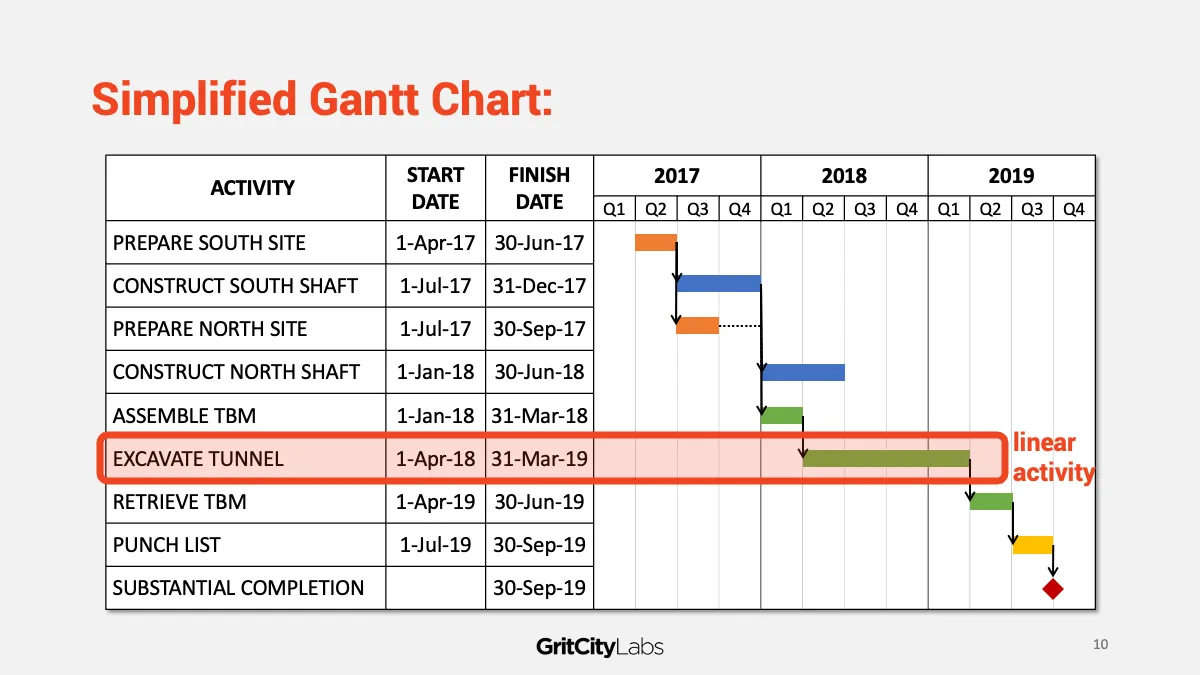
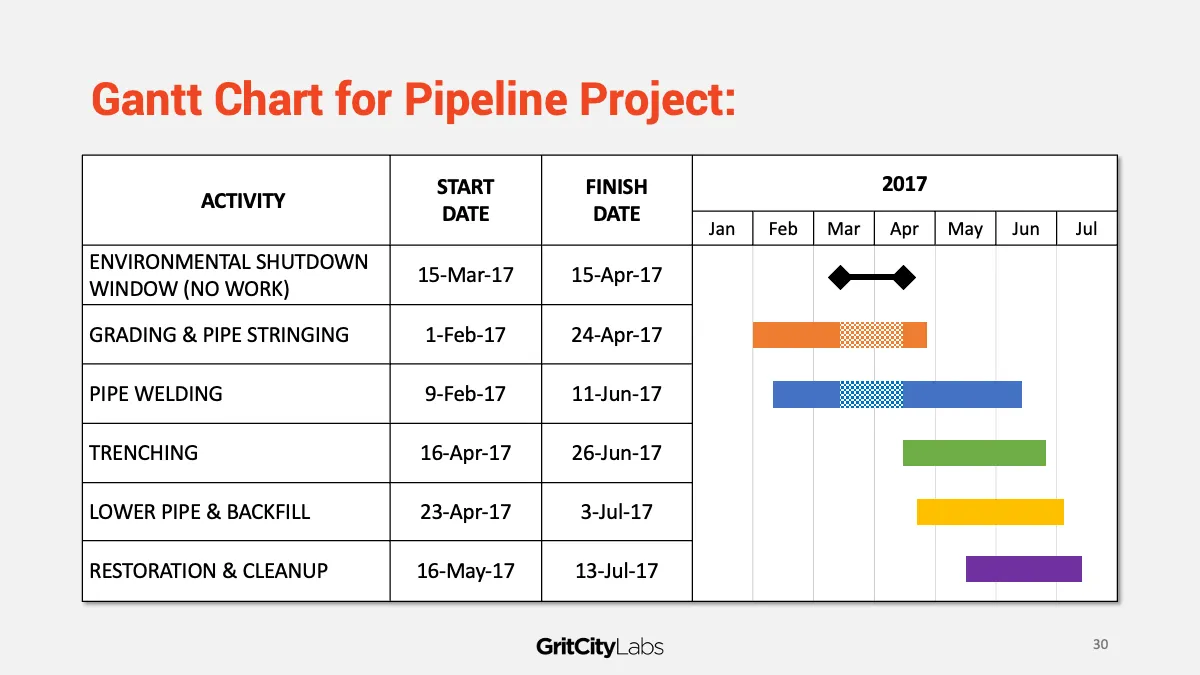
Your CPM schedule contains thousands of activities printed on dozens of pages of detailed Gantt charts that most of your team members can’t read. And Gantt charts don’t show the physical location of the work, so it’s difficult to see how one activity on page 6 might affect another activity on page 36. When only a few people can understand the schedule, the whole team is flying blind.
The Solution
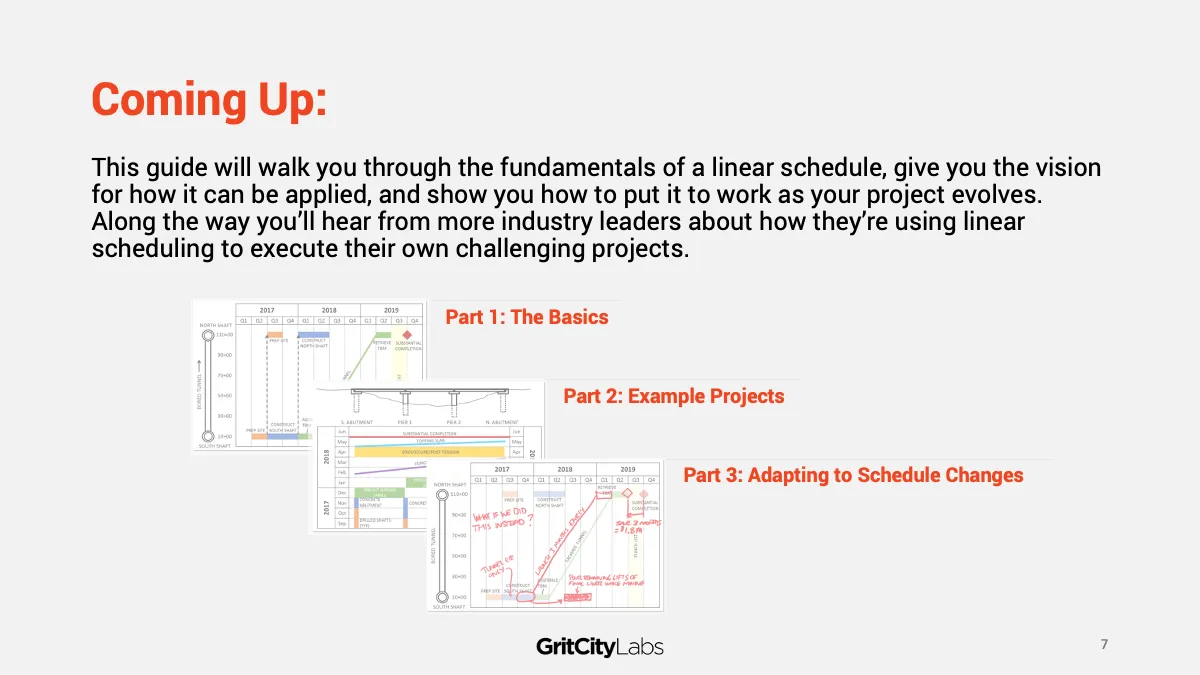
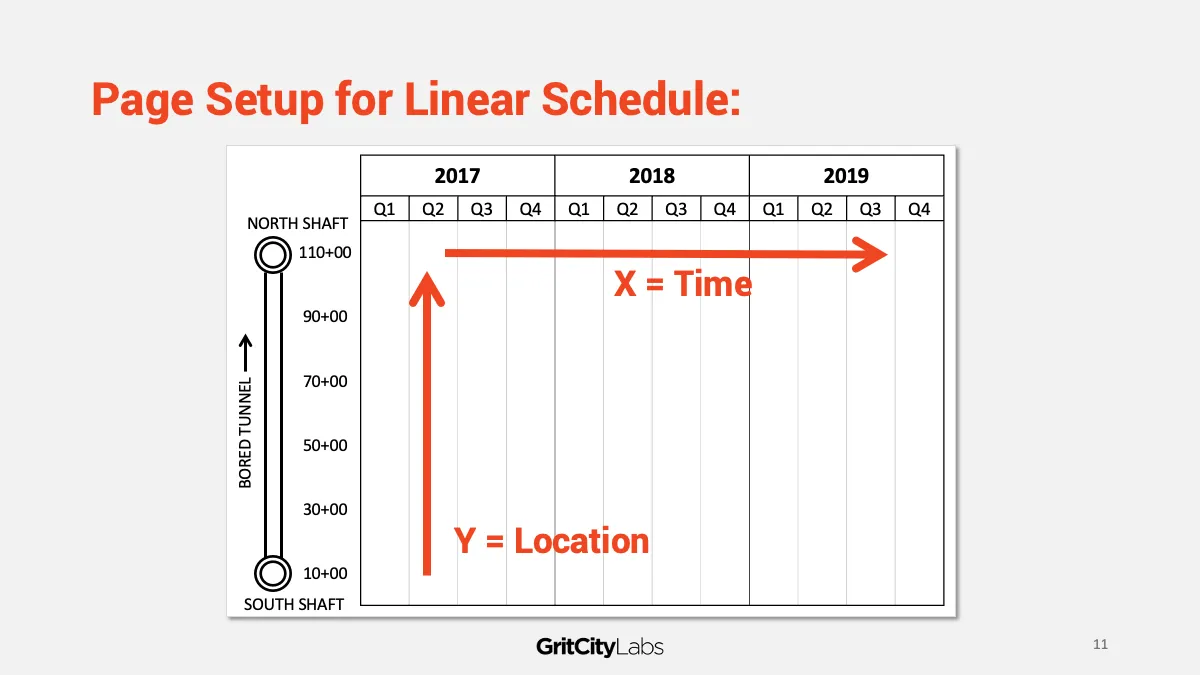
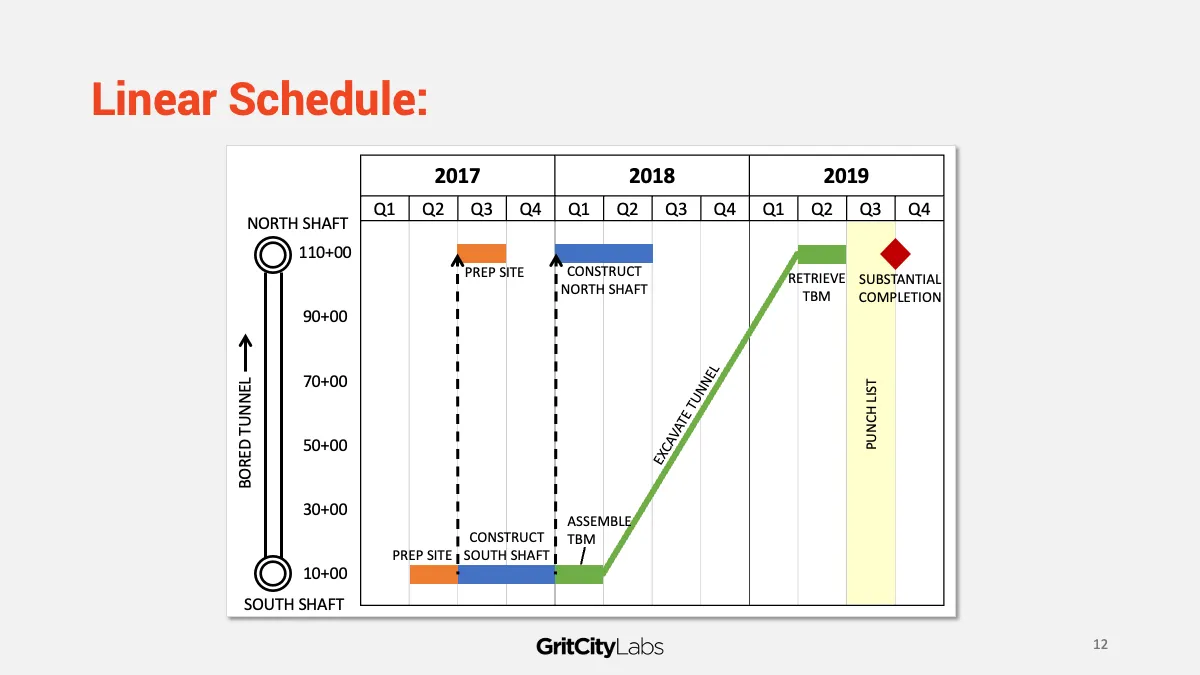
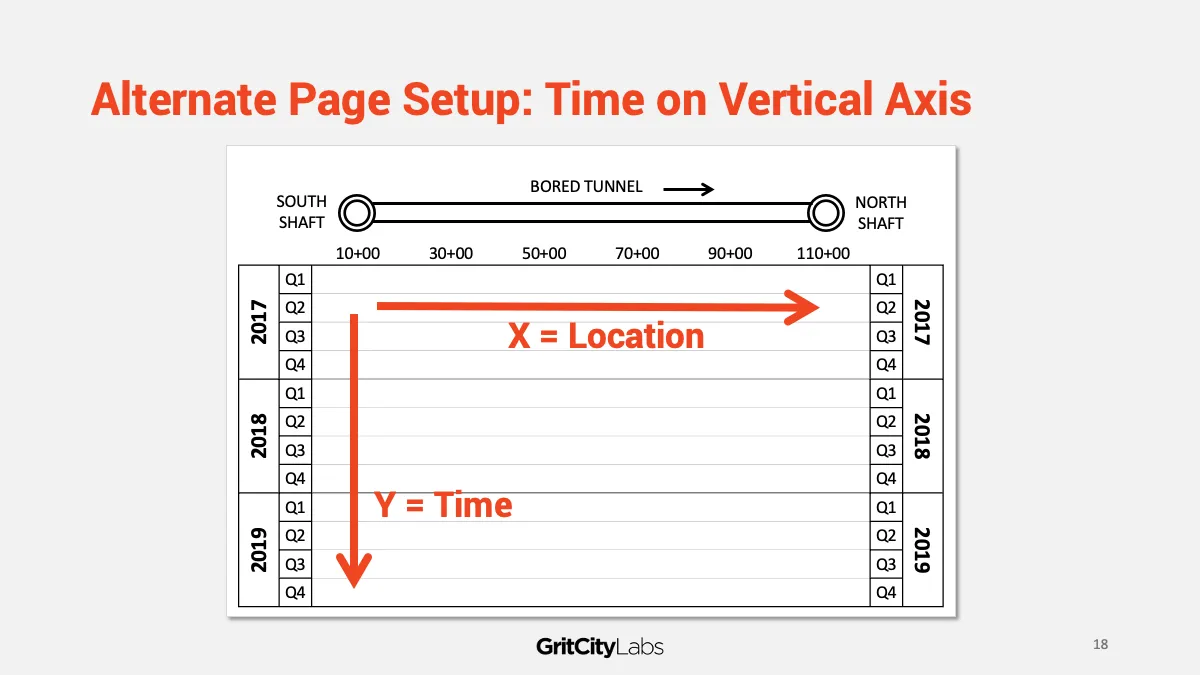
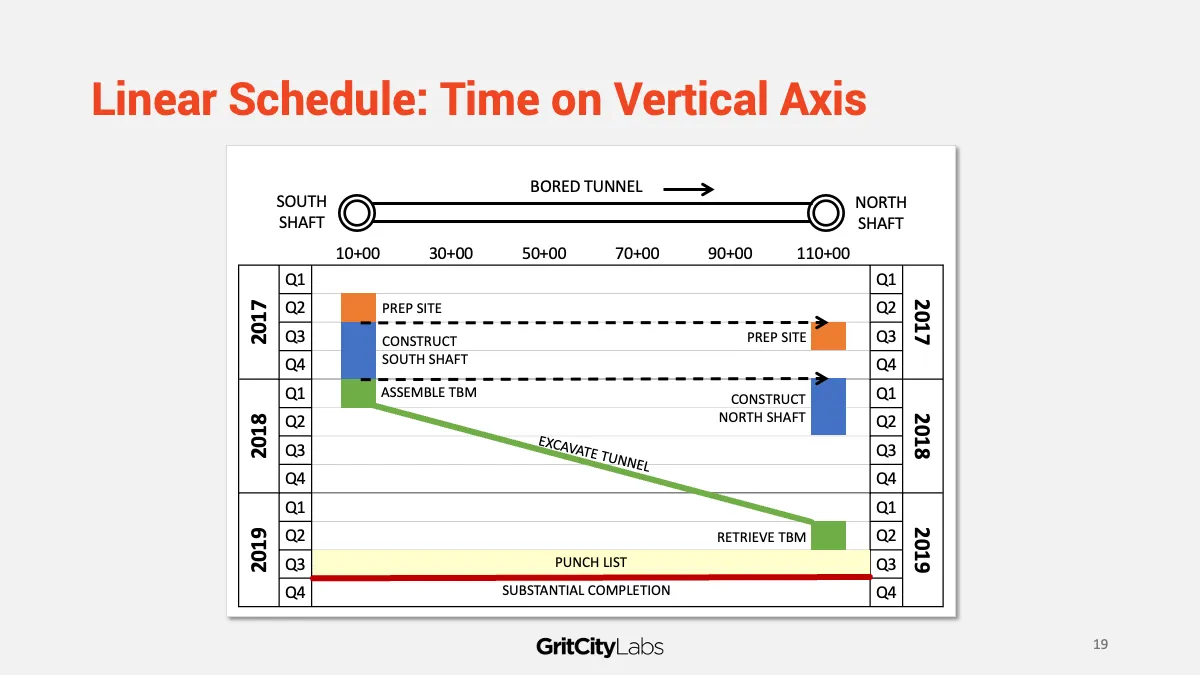
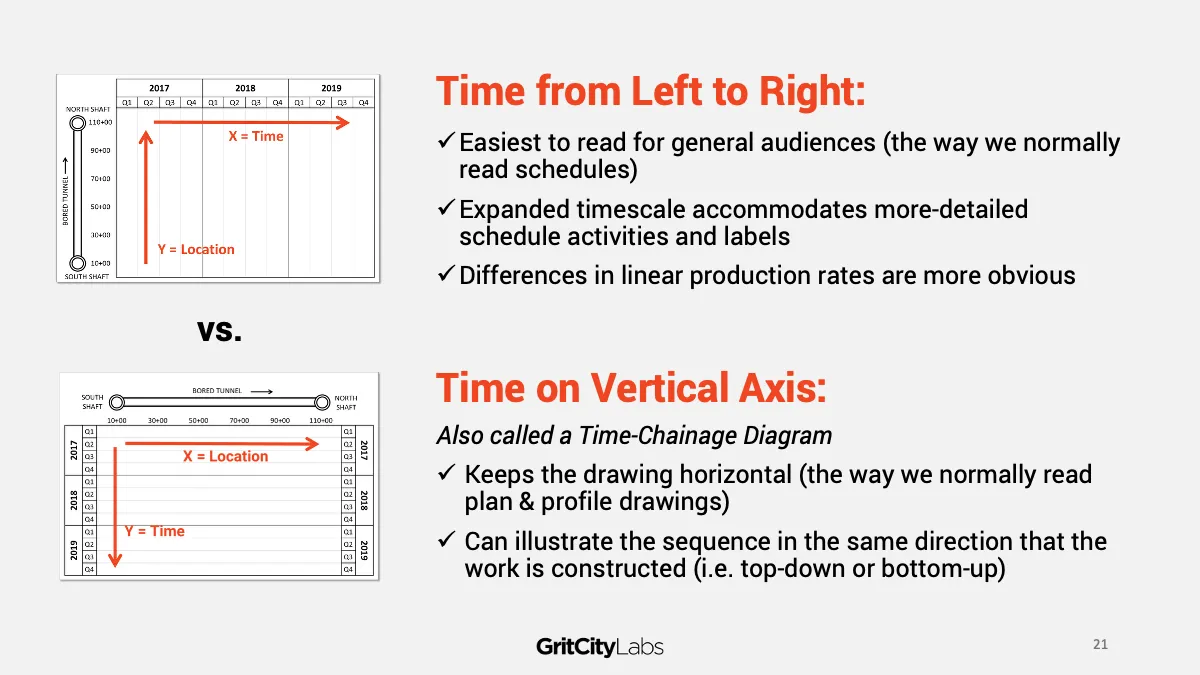
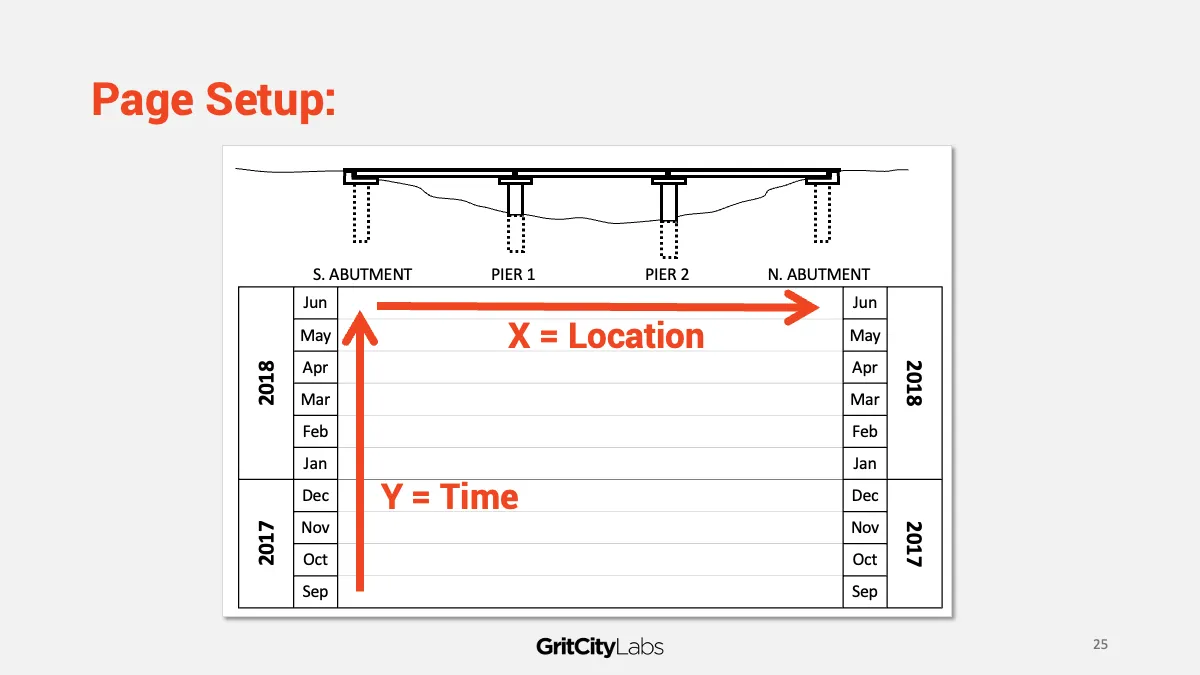
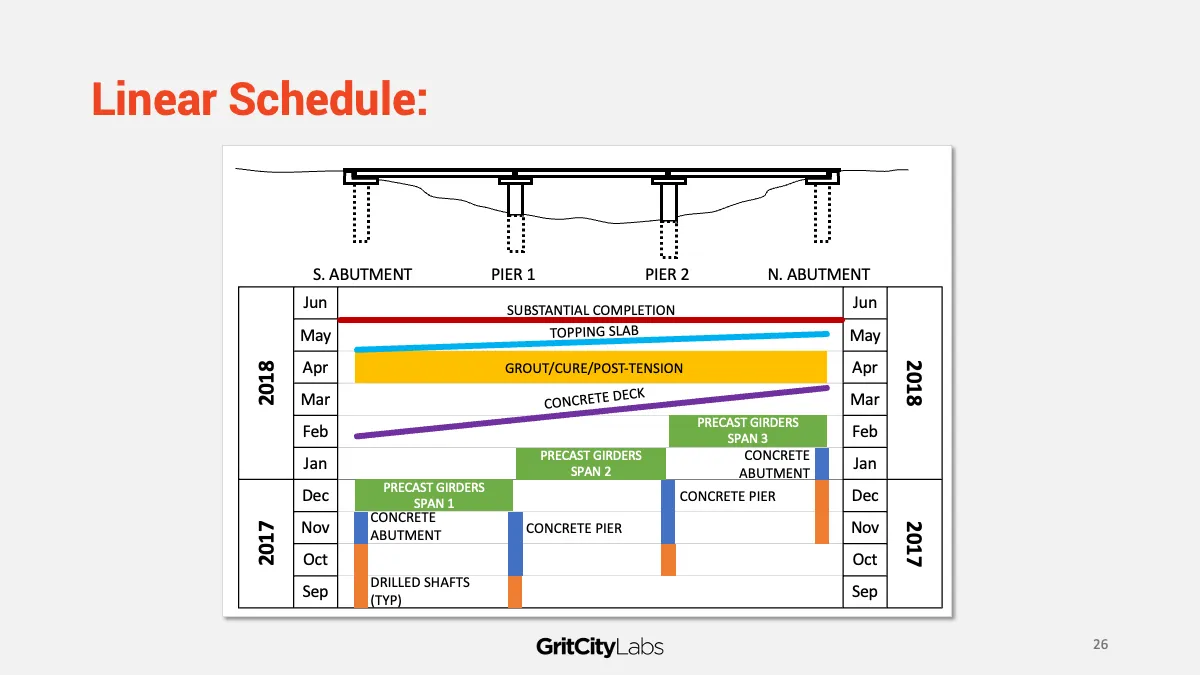
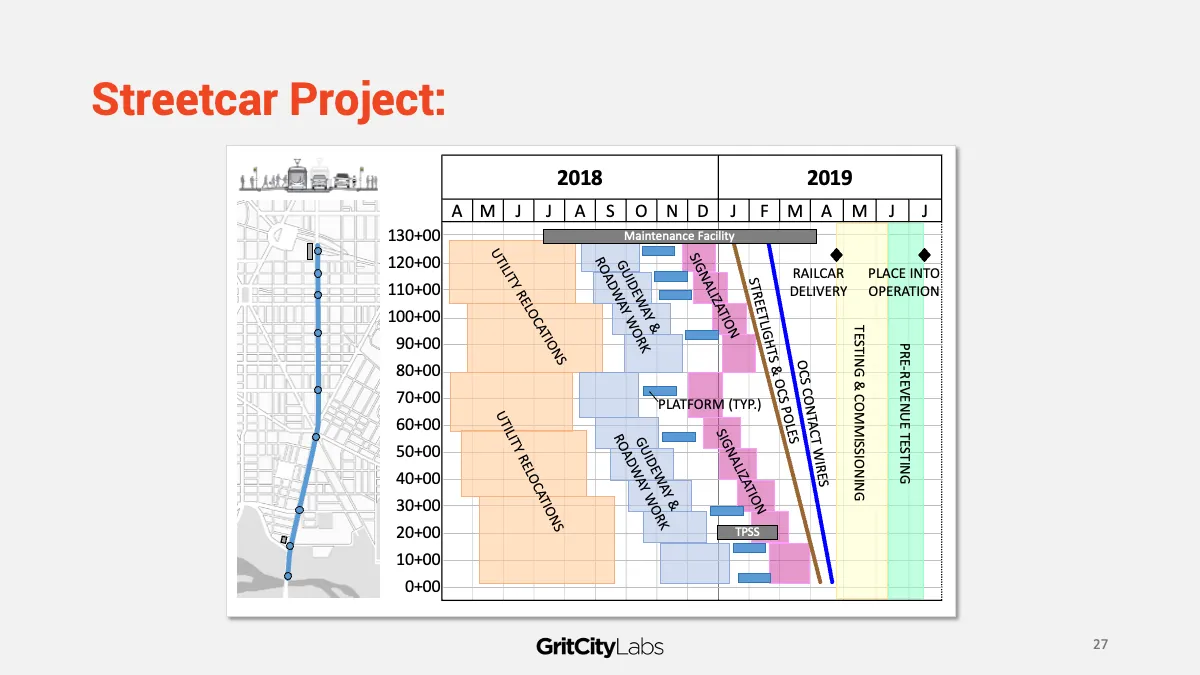
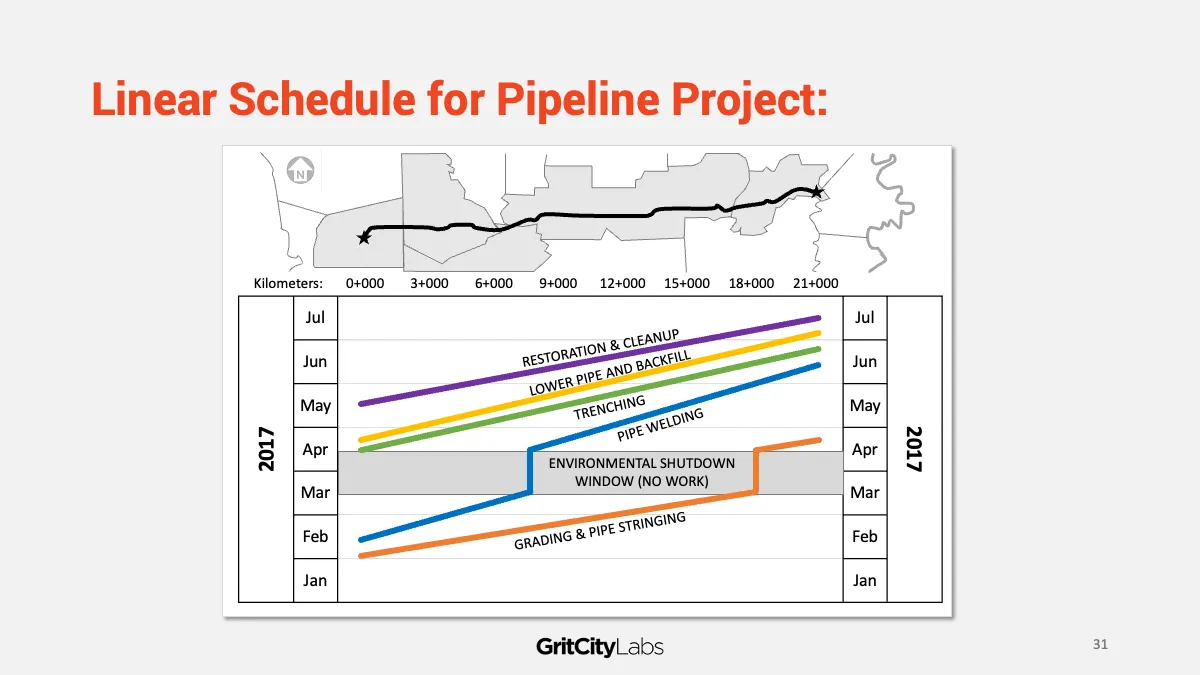
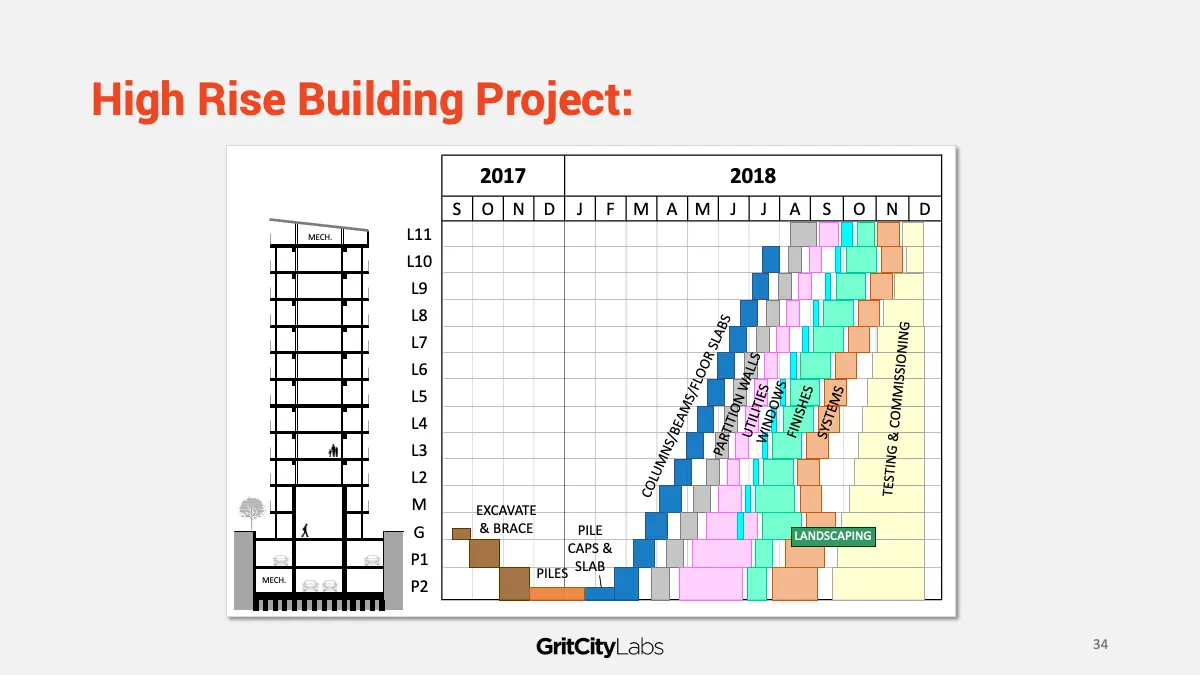
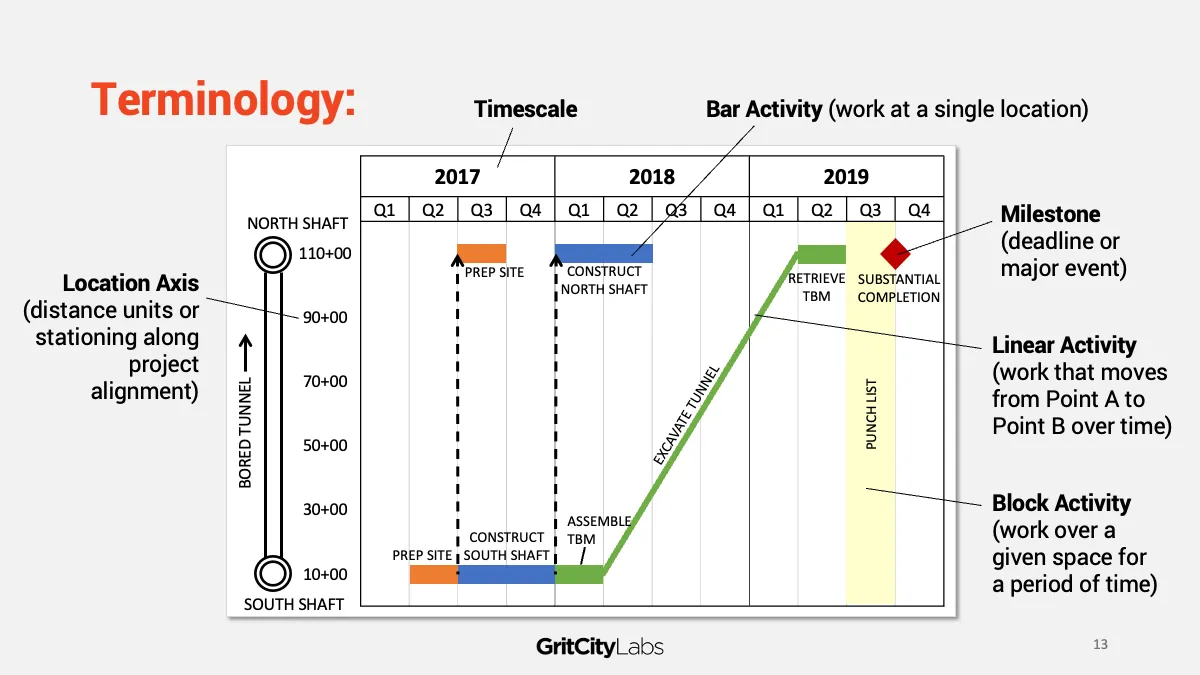
A linear schedule (also known as a time-chainage diagram) shows when work happens and where it happens. All on one page.
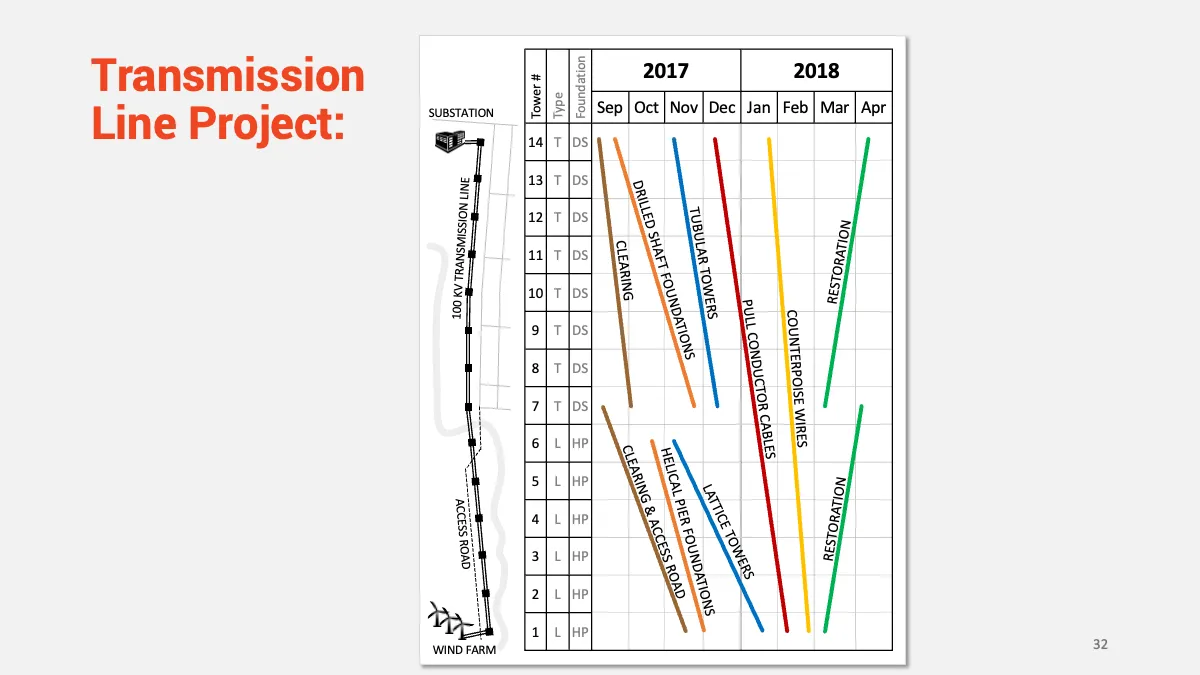
One axis is time. The other axis is location. The result is a schedule that shows how crews, equipment, and work move through your project from start to finish.
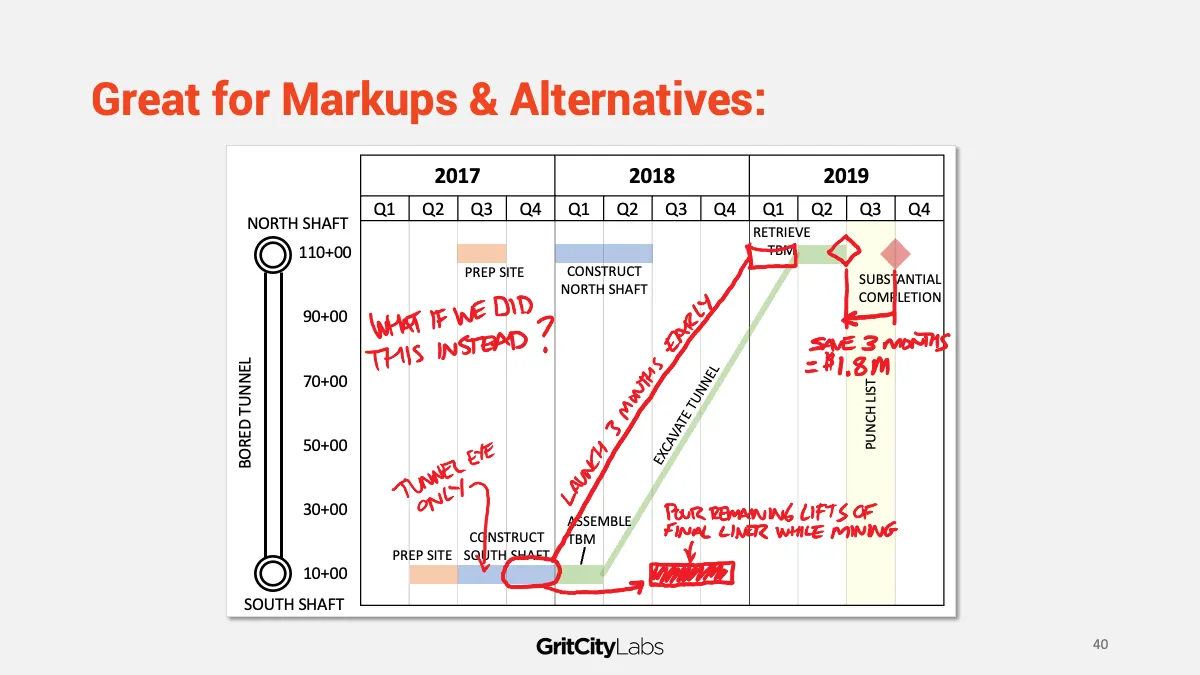
Easy to read. Easy to mark up. Easy to hand to your boss, your team members, the project owner, or any other project stakeholders.
How It Works
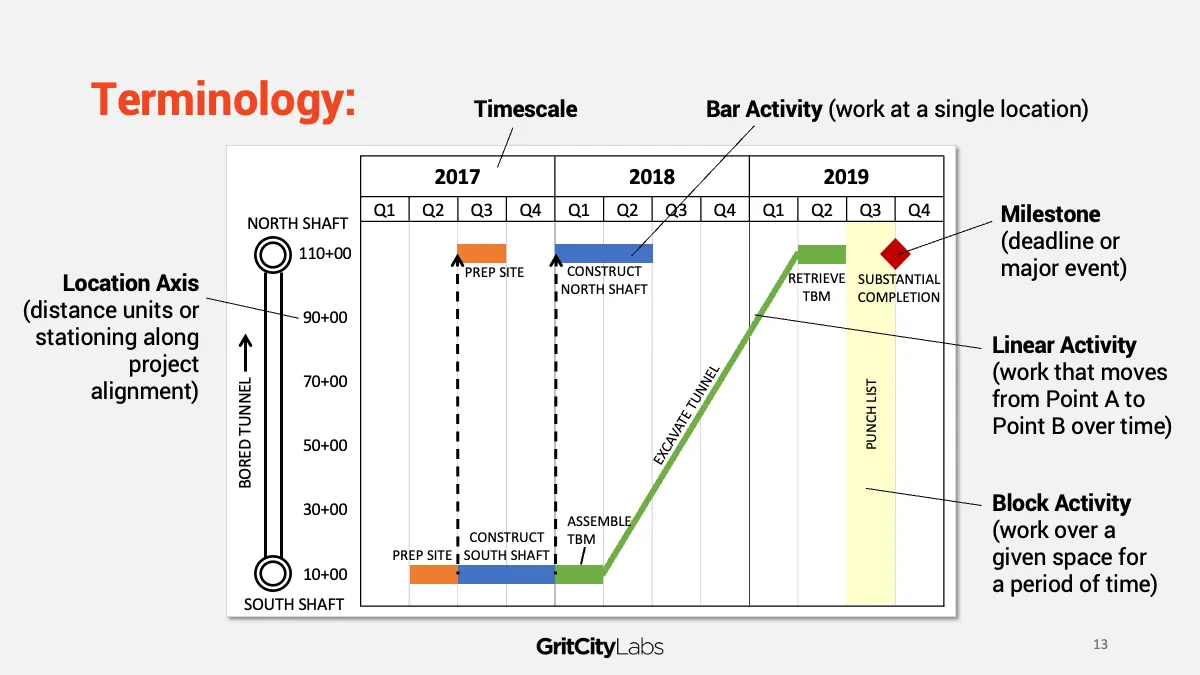
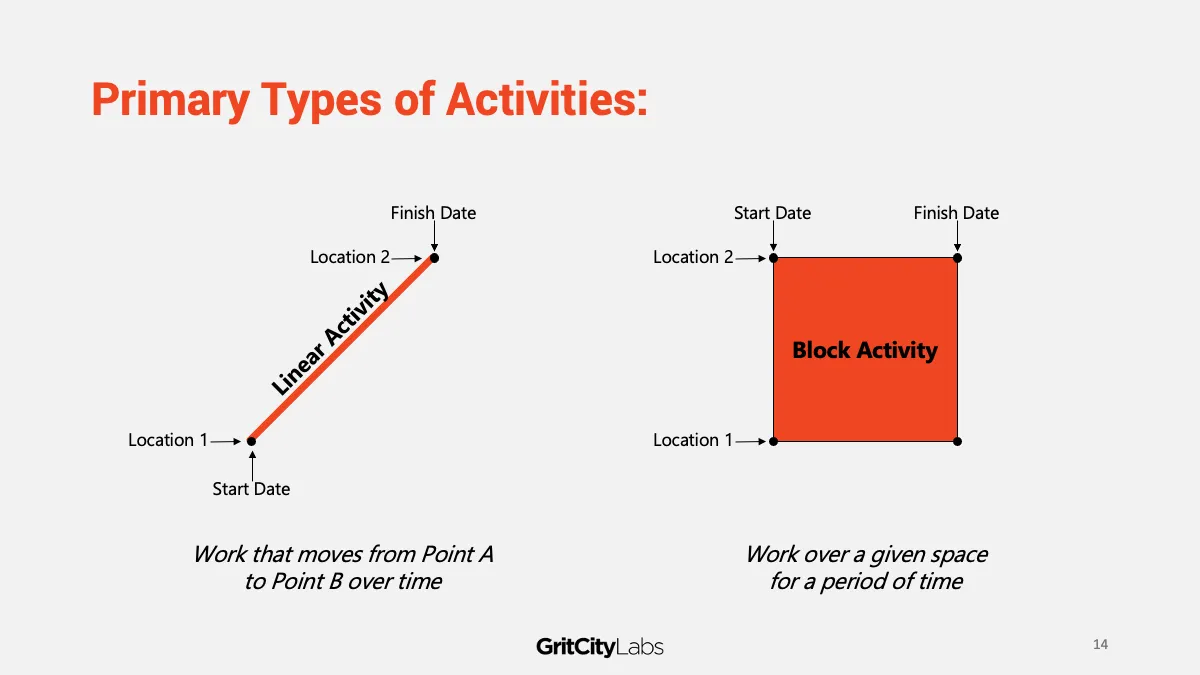
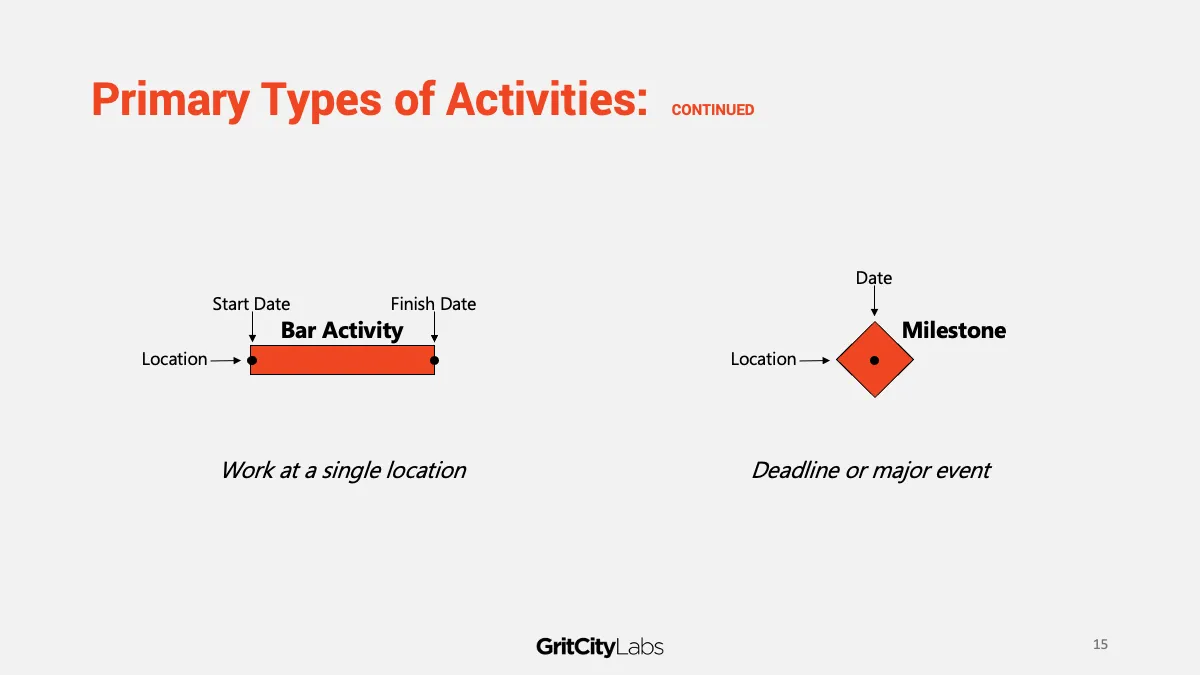
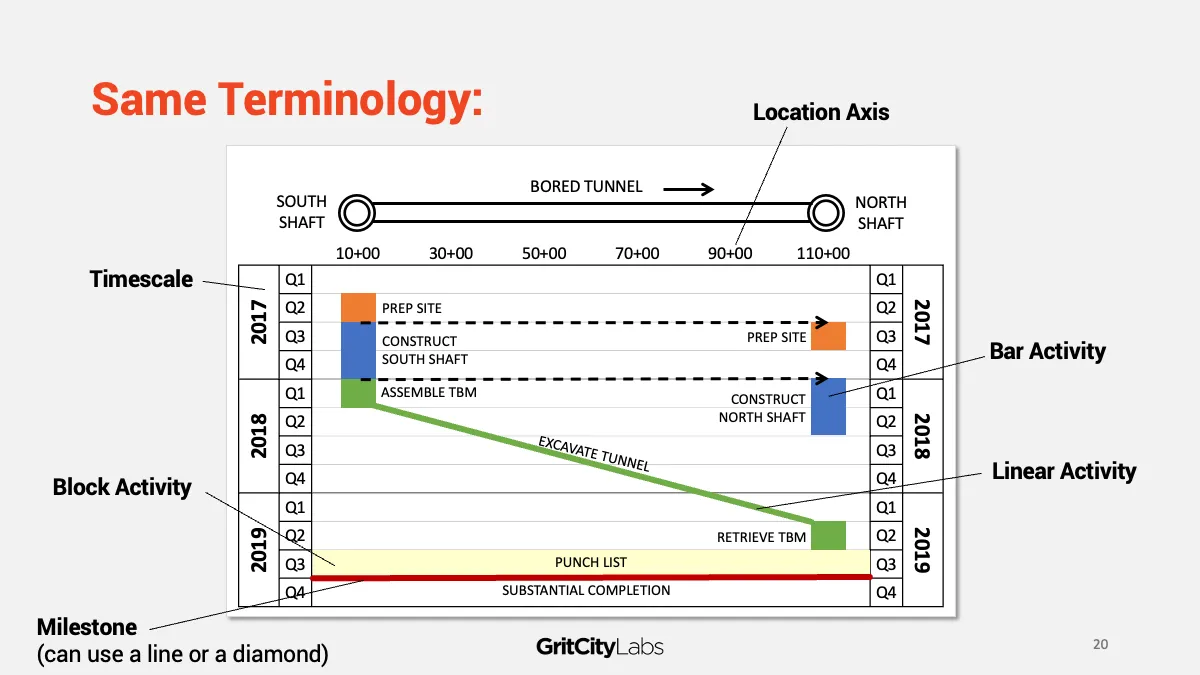
Linear schedules are built using four simple shapes.
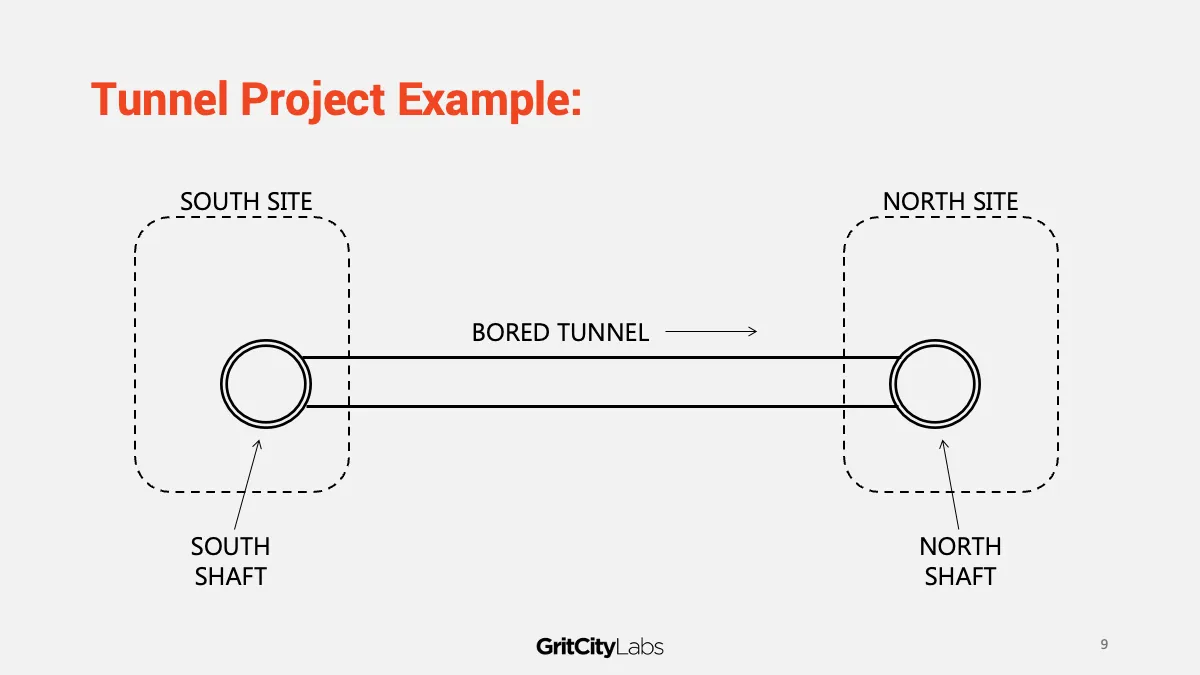
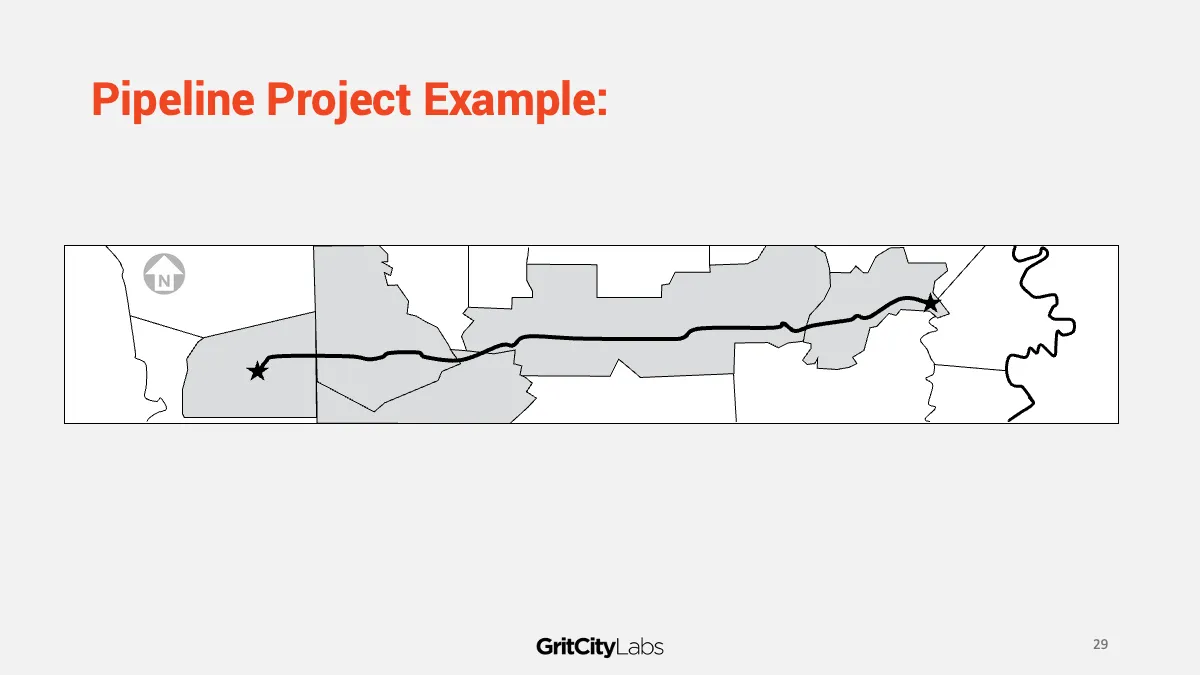
- A line shows work that moves through the project over time — like tunnel excavation or pipeline installation.
- A block shows work that covers an area for a period of time — like a construction zone or site prep area.
- A bar shows work at a single fixed location — like a shaft, pier, or building floor.
- A milestone marks a key date — like substantial completion or equipment delivery.
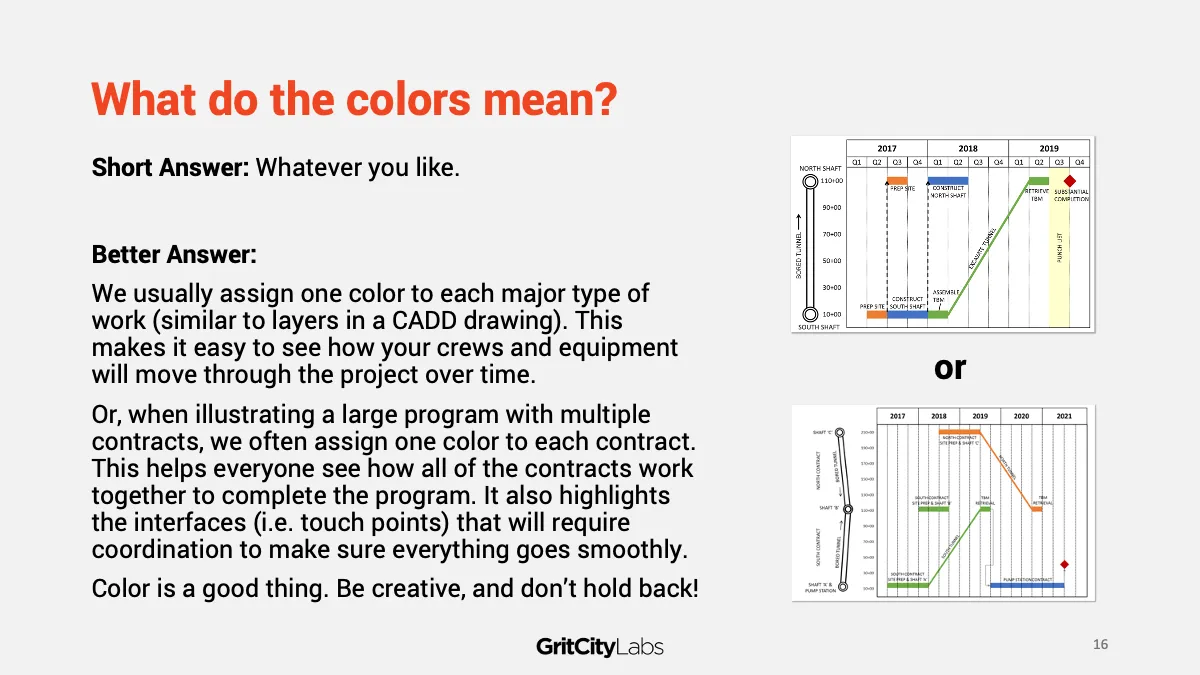
Color makes it even clearer.
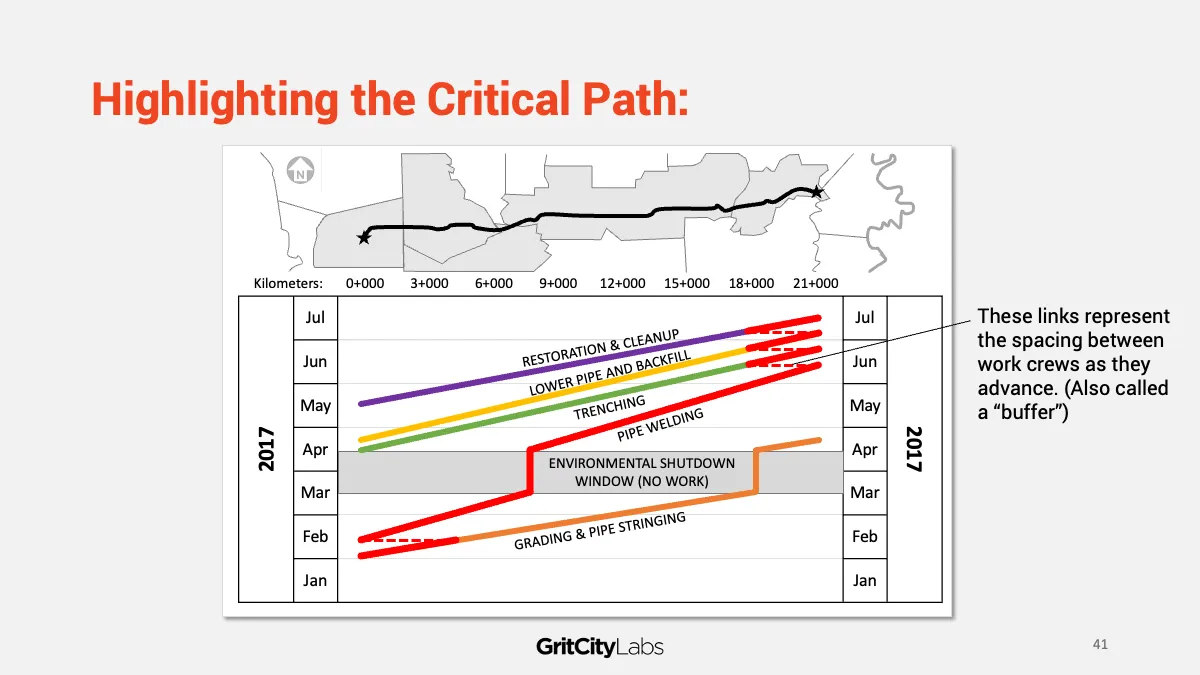
Assign one color per crew or work type and anyone can see immediately who is working where and when.
Where It Works
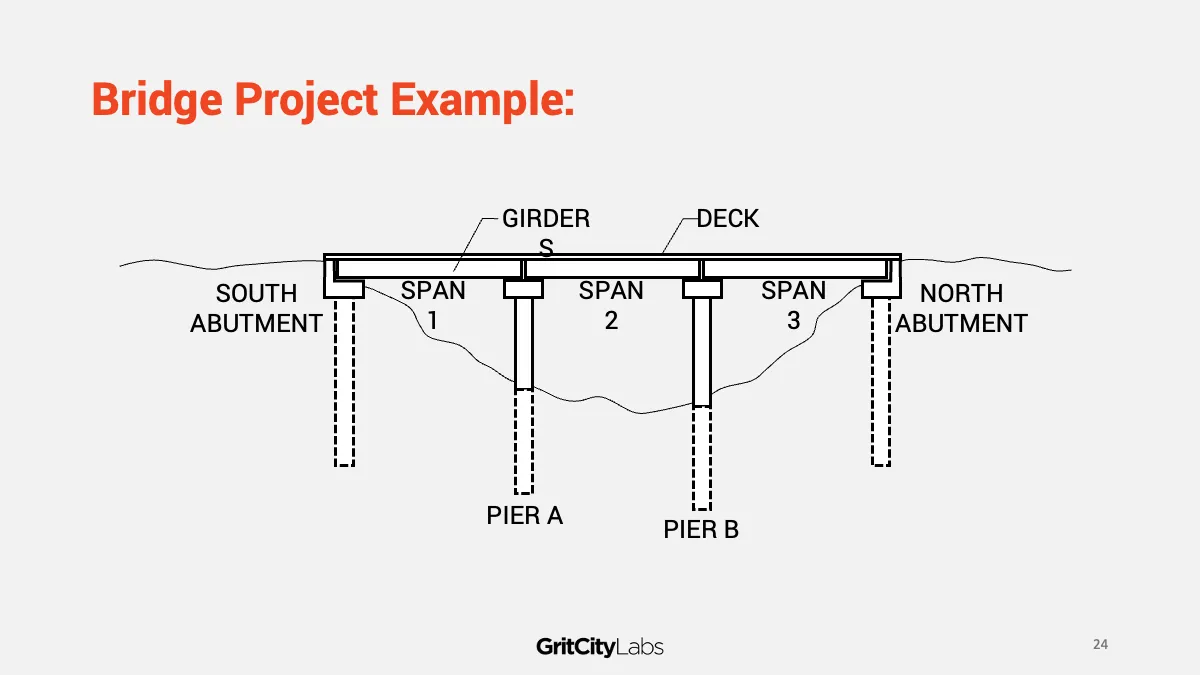
Linear scheduling is useful on any project where location matters. Tunnels. Bridges. Pipelines. Rail and streetcar. Transmission lines. High-rise buildings. If your crew moves through space over time, a linear schedule will show it more effectively than a Gantt chart.
During Construction
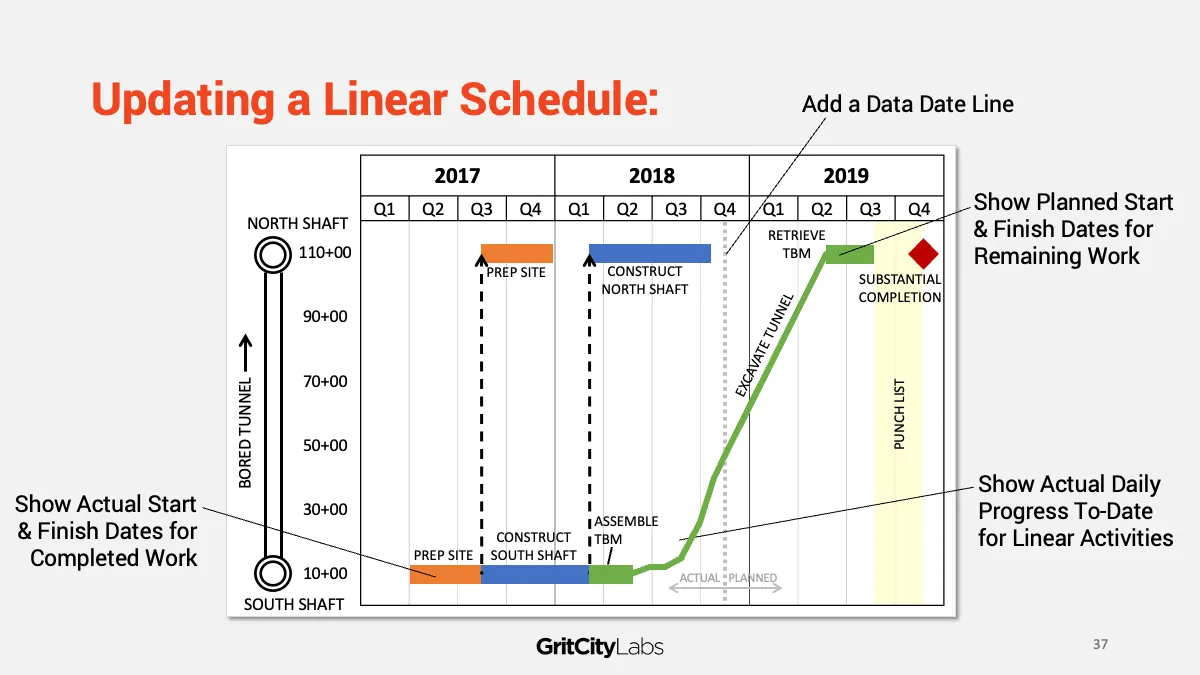
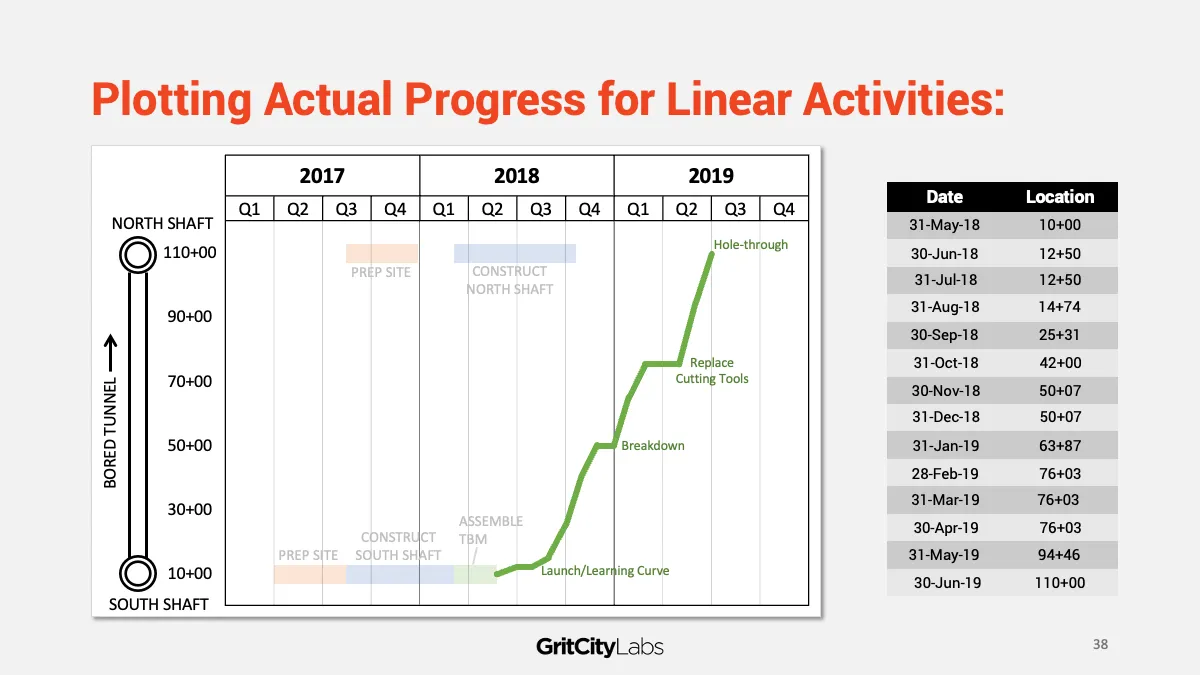
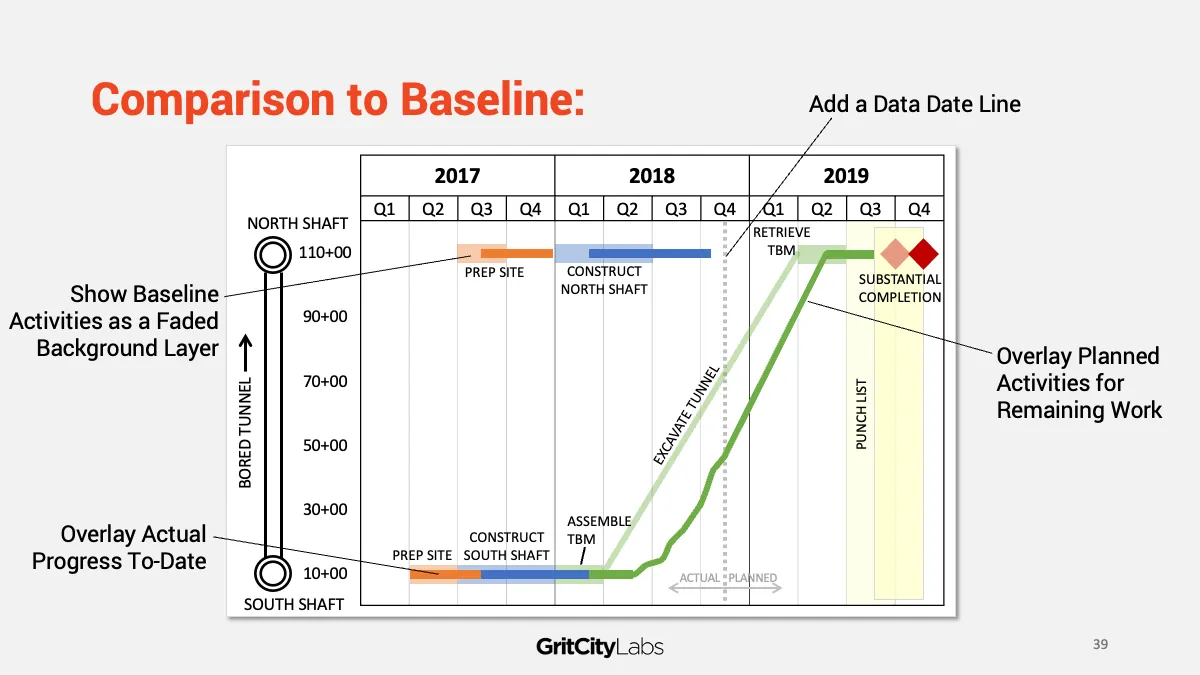
The schedule doesn’t stop being useful once work starts. Update it with actual progress, a data date, and your current forecast and it becomes your best tool for tracking what happened, what changed, and what comes next.
Frequently-Asked Questions
What is linear scheduling?
Linear scheduling is a visual method that shows construction activities by both time and
location. It’s especially useful when crews or equipment move through physical space
over time.
How is a linear schedule different from a Gantt chart?
A Gantt chart shows when activities happen. A linear schedule shows when and where, so you can see how crews move, where conflicts might happen, and how the whole project fits together.
What kinds of projects use linear scheduling?
Tunnels, highways, bridges, rail, pipelines, utilities, transmission lines, high-rise buildings — any project where the location of the work matters to the sequence.
Can you update a linear schedule during construction?
Yes. You can show actual progress, baseline comparison, current forecast, and schedule recovery all in one view.
Does a linear schedule replace a CPM schedule?
No. It works alongside your CPM schedule. The details stay in your scheduling software. The linear schedule makes the plan visible to the whole team.